
Free market report · Data to August 2026
Southern Downs property market
Southern Downs is still rising, just not as fast as last year. Prices have compounded at +9.7% a year for ten years, and the market fell in 1 of the last 15 years.
What happens next depends on jobs and people moving in, not the price chart. Those numbers are further down, and so is my written verdict on Southern Downs.
Houses · cycle position
SlowingThe Southern Downs house market is still growing, but the pace has come off its fastest point. Slowing markets often keep rising for years, just less quickly. See it on the Momentum Dial.
-3% to +15%
Modelled 12-month price range
A wide band means the model is unsure, not that a fall is likely.
+3.1%
Modelled 12-month rent change
Units · cycle position
SlowingThe unit market is still growing, but the pace has come off its fastest point. Slowing markets often keep rising for years, just less quickly. See it on the Momentum Dial.
-6% to +17%
Modelled 12-month price range
+5.8%
Modelled 12-month rent change
Is it too late?
Slowing on the dial means still rising, just not at last year's pace. Most markets spend more of the cycle here than anywhere else.
Southern Downs did +16.8% in the last 12 months. That is a big year, and big years are where buying on momentum alone gets people hurt. It does not mean the cycle is over. It means the entry price matters more.
Some markets are late. Honestly, some of the ones on this site are. The point of a 15 minute phone call is working out which ones are late for you, with your numbers, not the suburb's.
Free · Written by hand
Want my verdict on Southern Downs, in writing?
Whether I'd buy in Southern Downs now and why, the one suburb inside it I'd look at first with its price, rent, yield and growth, and what cuts against the area. Emailed within a business day. For investors weighing it up, not a valuation of your own place.
If it is useful, I will offer a 15 minute phone call. Take it or don't.
What we bought for clients in Queensland
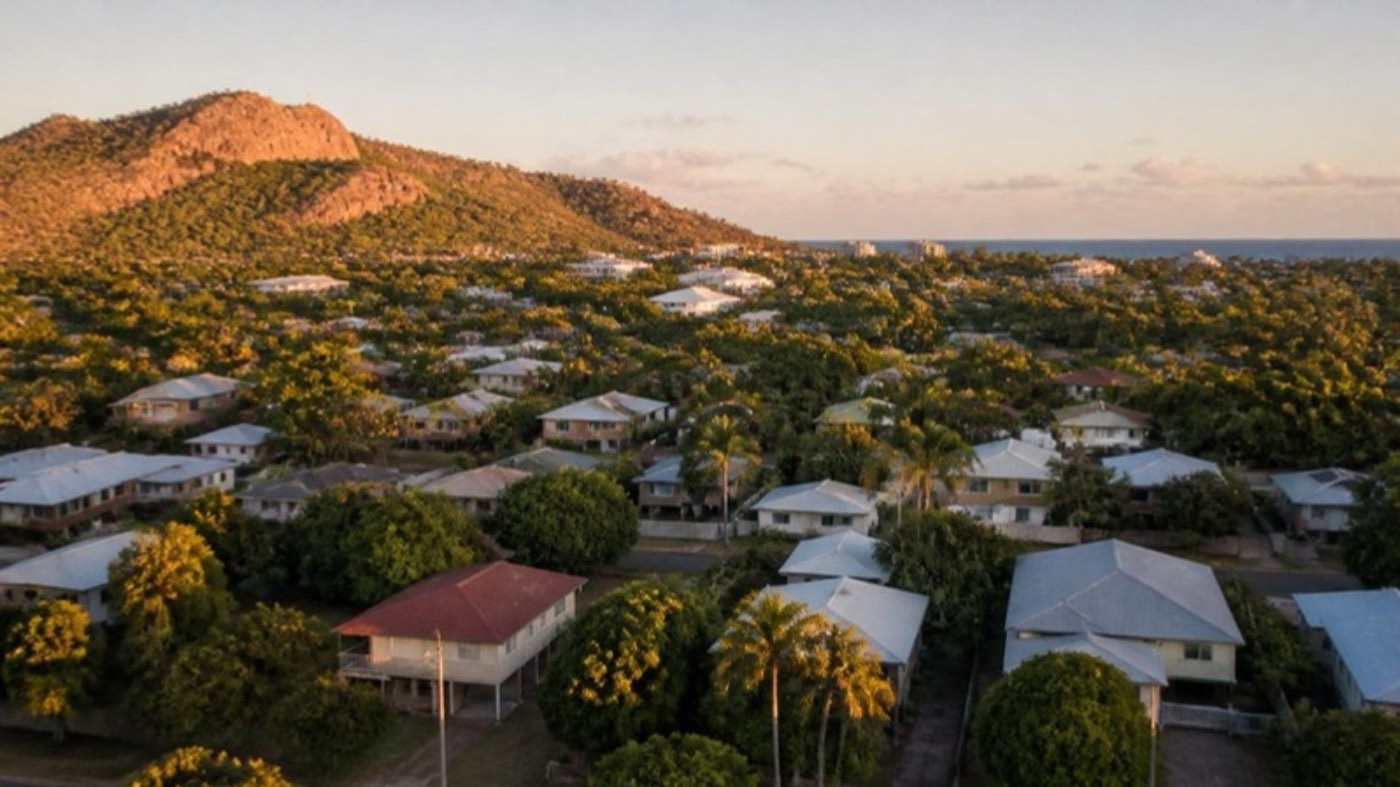
Southern Downs is home to 38,064 people. On the Buyers First Momentum Dial its house market currently reads Slowing, and units read the same. Here's the rest of the picture, in plain numbers.
Southern Downs is one of the 486 council areas on the Momentum Dial, our property clock. This page is the plain-numbers read.
At a glance · houses
Run Southern Downs's numbers yourself: what a typical house here costs to hold each week, or where it lands after 10 years. Both free, both pre-filled with this page's price and rent.
The numbers, explained
Southern Downs in charts.
The typical house in Southern Downs went from $263,804 in 2010 to $735,439 in August 2026. That is +179% in total, +6.4% a year. One down year in 15. That is a market that pauses rather than falls, and pauses are where the buying gets done.
Houses · price change each year · 2011 to 2026
Prices in Southern Downs fell in just one year out of 15
+179%
Since 2010
+9.7%
Per year, last 10 years
1 of 15
Years going backwards
-0.7%
Worst year (2011)
What this shows. How much the typical house price in Southern Downs went up or down each year. Teal bars are up years, red bars are down years, and the faded bar is this year so far.
Why it matters. The size of a good year matters less than how many bad years there were and whether they came in a row. Boring? Absolutely. But the length of the down stretch is what decides whether you get out the other side. Typical price at December each year, data from HtAG Analytics.
You don't need to know property to read this. Every chart below opens with the point in one line, then says what it shows and why we care. Teal is a good sign, amber is okay, red means watch it.
The scorecard · 7 things we check
Southern Downs scores 22 out of 35. Mixed.
prices are still rising but more slowly
1 of 15 years
1.6 new homes approved per 100 that exist
population growing 0.9% a year
4.3% unemployed, Australia 4.2%
a house costs 10.7 years of a local household's income
0.5% of rentals are empty, so about 1 in every 100
What this shows. Seven quick checks on Southern Downs, each scored out of five. Five is the reading we most want to see.
Why it matters. No single number tells you whether an area is a good buy. Together they show whether the pieces line up. These are bands, not rules: a council outside a band can still be the right buy for the right person, and one inside every band can still be wrong for you.
House prices since 2010 · Southern Downs vs the 5 most similar councils in QLD
Southern Downs has grown in step with similar councils over ten years
+15.8% vs +14.7%
A year, last 5 years
+8.7% vs +8.3%
A year, last 10 years
+6.2% vs +6.2%
A year, last 15 years
What this shows. The typical house price in Southern Downs every year, in teal, next to the middle of the five councils in QLD closest to it in size and starting price: Western Downs, South Burnett, Whitsunday, Livingstone, Lockyer Valley. The small "vs" number in each tile is those councils.
Why it matters. Growth here is the regional story rather than a local one. Nothing wrong with that, it just means you are buying the region.
Momentum · the last 36 months
Prices in Southern Downs are picking up speed right now
$729,802
3-month price, August 2026
+5.8%
3-month price vs 12-month price
826 vs 1,071
Houses sold, last 12 months vs the 12 before
What this shows. Two versions of the same price. The dotted teal line averages the last three months, so it reacts fast. The grey line averages the last twelve, so it moves slowly. The bars are how many houses sold each month.
Why it matters. The last three months are running ahead of the last twelve. That is what speeding up looks like before it shows in the yearly number.
New homes · approvals as a share of all the homes here
New homes in Southern Downs are keeping pace with the people
What this shows. For every 100 homes already in Southern Downs, how many new ones the council approved each year. The teal band is the range we call balanced.
Why it matters. New homes are arriving at about the pace the population absorbs them. Balanced. The home count is the population divided by the average household size, so treat the rate as a guide rather than a census.
Affordability · house price in years of local household income
A house in Southern Downs costs 10.7 years of a local family's income
What this shows. Take the typical house price and divide it by what a typical household here earns in a year. A bar of 7 means seven years of the whole household's income buys one house.
Why it matters. Expensive for the people who live here. Prices at this level need outside buyers to keep moving, and outside buyers are the first to leave when things wobble. Income is the 2021 Census figure carried forward at 3.5% a year, so it is an estimate, not a measurement.
Rents · typical weekly house rent, last 36 months · and how many rentals sit empty
Rent in Southern Downs is $500 a week, up 9.2% in a year
$500
A week, August 2026
+9.2%
Change in the last year
0.5%
Rentals sitting empty (tight)
What this shows. What a typical house in Southern Downs rents for each week, month by month. The empty-rentals number is the share of rental homes with nobody in them: under 1.5% is tight, over 3% means tenants have plenty of choice.
Why it matters. Rents rising faster than inflation means more people want to live here than there are homes to rent. That pressure eventually shows up in prices.
Rental yield · a year of rent as a share of the price, Southern Downs vs similar councils
Rent covers 3.5% of the price each year in Southern Downs
What this shows. Yield is simple: a whole year of rent divided by the house price. A $500,000 house renting for $500 a week earns $26,000 a year, which is a 5.2% yield.
Why it matters. Lower than similar councils, which are around 4.2%. Prices have run ahead of rents, so you are paying more of the loan yourself while you wait for growth. We don't buy on yield alone and we never set a yield cut-off; it is one piece of the picture, next to growth.
Free · Written by hand
Want Southern Downs and another area scored side by side?
Pick a council or suburb in the box above and every chart on this page overlays it. Then ask for the verdict here: both areas scored on the seven things we check, and which of the two I would buy in today.
Southern Downs against Western Downs, South Burnett and Whitsunday.
The QLD councils closest to Southern Downs in size, on the three numbers we weigh first. Best in each column is marked. Each has its own written report.
| Council | Cycle now | Typical house | Growth a year, 10 yrs | Down years | Vacancy |
|---|---|---|---|---|---|
| Southern Downs | Slowing | $735,439 | +9.7% | 1 of 15 | +0.5% |
| Western Downs | Slowing | $621,270 | +8.2% | 4 of 15 | +0.7% |
| South Burnett | Slowing | $628,007 | +9.7% | 3 of 15 | +0.8% |
| Whitsunday | Slowing | $717,238 | +8.6% | 3 of 15 | +0.9% |
The people
Who lives in Southern Downs.
The population has grown a steady +0.9% a year over the last five years. The growth is mostly people moving in from elsewhere in Australia, 864 of them on net over the last three years. Internal migration is the strongest kind of housing demand, because those people chose here on purpose. The median age is 48 and the median household brings in $1,108 a week (Census 2021). 70% of households own or are paying off their home. Owner-occupier markets like this tend to hold their nerve through the cycle, because nobody is forced to sell an address they live at.
Population · ABS estimates 2015 to 2025
Southern Downs is growing steadily: 38,064 people, up +0.9% a year
38,064
People, 2025
+0.9% vs +1.2%
A year, last 5 years · typical QLD council
+0.7%
A year, last 10 years
Why it matters. Steady growth is enough to keep demand ahead of supply, as long as building stays sensible.
Where the growth came from · last 3 years
Most new residents chose Southern Downs on purpose: 864 moved in from elsewhere in Australia
Net change: +1,117 people over three years.
What this shows. Three ways a place gains or loses people: babies born minus people who died, people who moved here from another part of Australia, and people who arrived from overseas. Bars to the right add people, bars to the left take them away.
Why it matters. People who move here from another part of Australia are the strongest kind of demand. They compared it with somewhere else and picked here.
Age and households · Census 2021
Southern Downs is older than the typical QLD council: median age 48 vs 40
Southern Downs Typical QLD council (middle of 58)
Why it matters. An older area leans on retirees and downsizers. Single-level homes near health services do best, and turnover tends to be lower.
Income and who owns the homes · Census 2021
Most homes in Southern Downs are owner-occupied: 70% own or are paying off, 25% rent
Own or paying off Renting Other
Why it matters. Owner-occupier markets hold their nerve through the cycle, because nobody is forced to sell the address they live at.
New supply
What's being approved to build.
269 dwellings were approved in FY26, 195 of them houses. Approvals are clearly trending up, so more supply is coming. Whether that's a problem depends on whether the population keeps outrunning it. On the non-residential side, $24 million of building was approved in FY26, $3 million of it public money. Governments build where they expect people. Within that, $9 million of education and health buildings have been approved across the last three financial years. Schools and hospitals are the most honest signal governments give about where they expect families.
Homes approved · ABS, by financial year
Building in Southern Downs is steady: 269 homes approved in FY26
Houses Units, townhouses and other
269
Homes approved, FY26
72%
Of them houses
1.6%
New homes per 100 that exist
What this shows. How many new homes the council approved each financial year, split into houses and everything else. Approved is not built, but it is the earliest warning of supply on the way.
Why it matters. Enough building to house the newcomers without flooding the market. Boring is good here.
Commercial and industrial building approved · ABS
Government building spend in Southern Downs has eased: $3m approved in FY26
Government projects All non-residential
$24m
All sectors, FY26
$3m
Government, FY26
$9m
Schools and health, last 3 years
What this shows. The dollar value of shops, offices, schools, hospitals and other non-home buildings approved each year. The darker bar is the government's share.
Why it matters. Governments build where they expect people. Schools and hospitals are the most honest signal they give about where families are heading. For the named projects behind these numbers, ask for the full report.
Jobs
Who's working in Southern Downs.
Work here runs on health care and social assistance (14% of working residents), ahead of agriculture and retail trade. 1,222 more residents are in work than five years ago (+7.5%). Unemployment tracks close to the national average at 4.3%. On the ABS advantage index it ranks in the bottom 30% nationally. That usually means better yields, and it means doing your homework street by street.
Jobs · ABS small-area estimates, March 2026
1,222 more people in Southern Downs have a job than five years ago
17,572
Residents in work
4.3% vs 4.2%
Unemployed · Australia
+7.5%
Jobs change, 5 years
Southern Downs Australia
Why it matters. Strong jobs growth shows up in housing demand with a lag. People get the job first and buy the house a year or two later.
Who employs people here · Census 2021
Health care and social assistance employs more Southern Downs residents than any other industry, 14% of them
What this shows. The five industries that employ the most residents, as a share of all jobs. The tag is the ABS advantage score: Southern Downs sits in decile 3 of 10 nationally, where 10 is the most advantaged.
Why it matters. A spread of employers means no single closure can empty the town. That is the kind of job base that holds house prices through a downturn.
The outlook
Is Southern Downs worth buying into?
Put the drivers together and the case for Southern Downs is: net internal migration in its favour, a job base that has expanded. None of this guarantees anything. It tells you where to look harder, which is what a report like this is for.
Free · Written by hand
That's the data. The written report is the call: whether I'd buy in Southern Downs now and why, the one suburb inside it I'd look at first with its price, rent, yield and growth, and what cuts against the area.
If it is useful, I will offer a 15 minute phone call. Take it or don't.
Market Pulse · Monthly · Free
Get the next dial reading in your inbox.
Once a month I write up where the dial moved, which council areas sped up or slowed, and what I would actually do about it. Southern Downs gets a mention whenever it moves.
No listings. One email a month. Reply with the word stop and you are off.
Inside the council area
The suburbs of Southern Downs, ranked.
Next step. See what's for sale in Warwick on realestate.com.au or Domain. Then send me the address before you make an offer. That is the part the data cannot do.
All 108 suburbs and localities in Southern Downs
Allan · Allora · Amiens · Applethorpe · Ballandean · Bapaume · Berat · Bony Mountain · Broadwater · Canningvale · Cannon Creek · Cherry Gully · Clintonvale · Cottonvale · Cunningham · Dalcouth · Dalveen · Danderoo · Deuchar · Diamondvale · Elbow Valley · Ellinthorp · Emu Vale · Eukey · Fletcher · Fleurbaix · Forest Springs · Freestone · Girraween · Gladfield · Glen Aplin · Glen Niven · Glengallan · Glenlyon · Goldfields · Goomburra · Greenlands · Greymare · Hendon · Junabee · Karara · Killarney · Kyoomba · Leslie · Leslie Dam · Leyburn · Loch Lomond · Lyra · Maryvale · Massie · Mingoola · Montrose · Morgan Park · Mount Colliery · Mount Marshall · Mount Sturt · Mount Tabor · Mount Tully · Murrays Bridge · North Branch · Nundubbermere · Old Talgai · Palgrave · Passchendaele · Pikedale · Pikes Creek · Pozieres · Pratten · Rodgers Creek · Rosehill · Rosenthal Heights · Severnlea · Silverwood · Sladevale · Somme · Springdale · Stanthorpe · Storm King · Sugarloaf · Sundown · Swan Creek · Swanfels · Talgai · Tannymorel · Thane · Thanes Creek · The Falls · The Glen · The Head · The Hermitage · The Summit · Thorndale · Thulimbah · Toolburra · Tregony · Upper Freestone · Upper Pilton · Upper Wheatvale · Victoria Hill · Wallangarra · Warwick · Wheatvale · Wildash · Willowvale · Wiyarra · Womina · Wyberba · Yangan
General information only, not financial or investment advice. Cycle positions and projections are modelled LGA-level figures to August 2026, sourced from HtAG Analytics. Population and approvals are ABS estimates; employment is SALM smoothed data; income, age and tenure are Census 2021. None of it can see street quality, flood maps, zoning or the contract, which is where deals are actually won and lost. Get advice on your own situation before acting.
Free · No call booked · Answered by Dan
One question about Southern Downs?
You have read the data. If there is one thing you want a straight answer on, about Southern Downs or about whether it fits what you are doing, ask it here. I answer these myself, usually the same day, and it does not put you on a call list.
Data finds the area. It doesn't buy the house.
We narrow 15,000 suburbs to the top 5 for each client, then find the street and the property. If Southern Downs is on your list, that's a conversation worth having early.